Ozone Pollution in CDMX and Guadalajara
Diego Valle-Jones
2026-06-03
Source:vignettes/articles/pollution_cdmx_vs_guadalajara.Rmd
pollution_cdmx_vs_guadalajara.RmdWe can compare ozone pollution trends in the two most ozone-polluted cities in Mexico: CDMX and Guadalajara.
First, we load the packages needed for the analysis:
## Auto-install required R packages
packs <- c("dplyr", "ggplot2", "lubridate", "sp", "ggmap", "gstat", "zoo",
           "tidyr", "rsinaica")
load_pkg <- function(pkg) {
  suppressWarnings(require(pkg, character.only = TRUE))
}
success <- vapply(packs, load_pkg, logical(1))
missing <- packs[!success]
if (length(missing)) {
  install.packages(missing)
  vapply(missing, load_pkg, logical(1))
}
Download data
## Download a single month of data for all Guadalajara and CDMX stations
get_month <- function(start_date, end_date, net, parameter){
bind_rows(
lapply(stations_sinaica$station_id[stations_sinaica$network_name %in% net],
sinaica_station_data, parameter, start_date, end_date, "Crude")
)
}
## Download 2018 data, one month at a time
cdmx <- bind_rows(
mapply(get_month,
seq(as.Date("2018-01-01"), as.Date("2018-12-01"), by = "month"),
seq(as.Date("2018-02-01"), as.Date("2019-01-01"), by = "month") - 1,
"Valle de México",
"O3",
SIMPLIFY = FALSE)
)
guad <- bind_rows(
mapply(get_month,
seq(as.Date("2018-01-01"), as.Date("2018-12-01"), by = "month"),
seq(as.Date("2018-02-01"), as.Date("2019-01-01"), by = "month") - 1,
"Guadalajara",
"O3",
SIMPLIFY = FALSE)
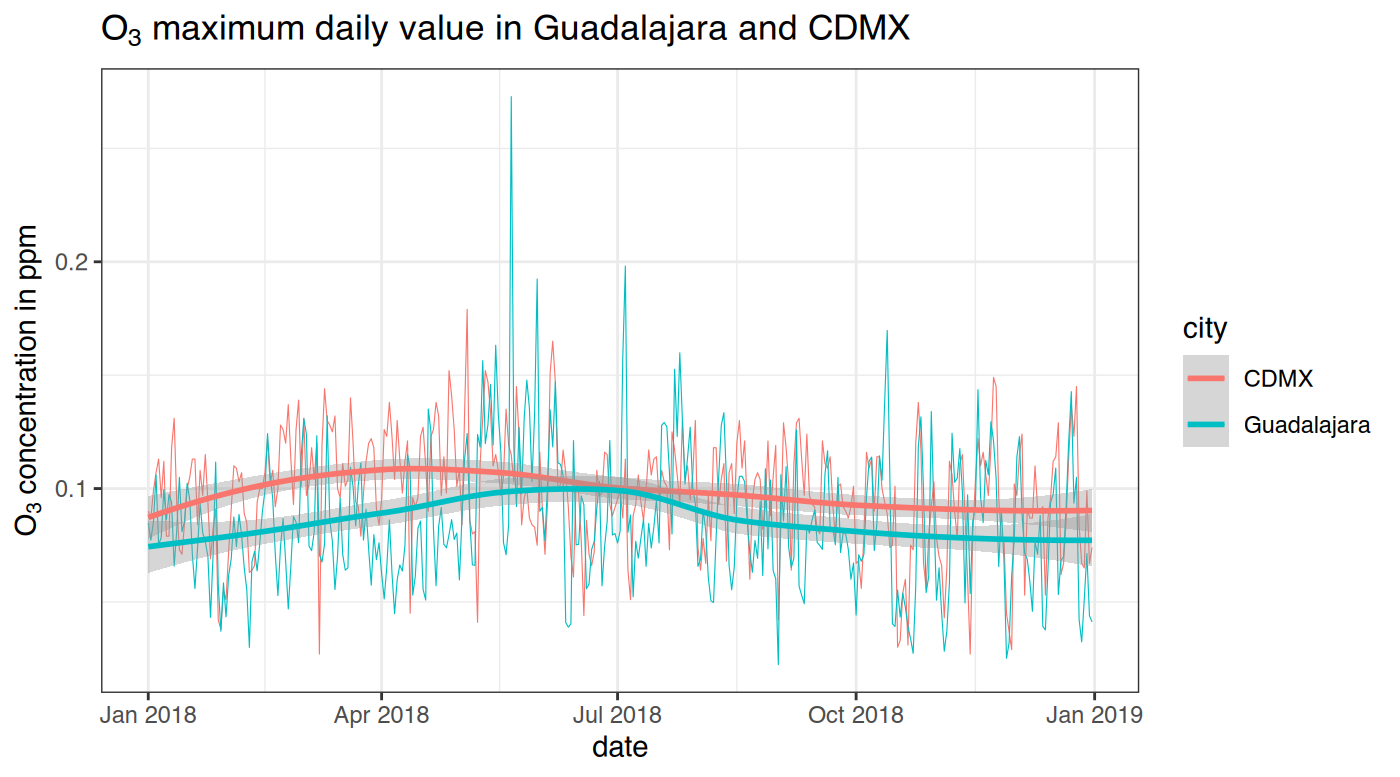
)We’ll be comparing the maximum daily ozone values among all stations.
Plot
And finally, we plot the data.
ggplot(rbind(cdmx, guad), aes(as.Date(date), max, group = city, color = city)) +
  geom_line(size = .2) +
  geom_smooth(method = 'loess') +
  xlab("date") +
  ylab(expression(paste(O[3], " concentration in ppm"))) +
  ggtitle(expression(paste(O[3],
                           " maximum daily value in Guadalajara and CDMX"))) +
  theme_bw()
#> Warning: Using `size` aesthetic for lines was deprecated in ggplot2 3.4.0.
#> ℹ Please use `linewidth` instead.
#> This warning is displayed once per session.
#> Call `lifecycle::last_lifecycle_warnings()` to see where this warning was
#> generated.
#> `geom_smooth()` using formula = 'y ~ x'