Unfortunately, the data that measuring stations submit to SINAICA sometimes contain errors. While stations and SINAICA are intended to flag erroneous data internally, this does not always occur. Additionally, some stations do not transmit their data to SINAICA reliably.
First, let’s load the packages necessary for the analysis.
## Auto-install required R packages
packs <- c("dplyr", "ggplot2", "lubridate", "rsinaica")
load_pkg <- function(pkg) {
  suppressWarnings(require(pkg, character.only = TRUE))
}
success <- vapply(packs, load_pkg, logical(1))
missing <- packs[!success]
if (length(missing)) {
  install.packages(missing)
  vapply(missing, load_pkg, logical(1))
}
Incomplete data
The data is incomplete because some networks do not report all measured pollutant values in a timely manner. For example, the Mexicali air quality website reports recent PM10 values. However, when querying SINAICA for the same period across all Mexicali stations, no recent PM10 data is available for download.
mexicali <- stations_sinaica[stations_sinaica$network_name %in% "Mexicali", 1:5]
## All PM10 station in Mexicali are manual
ll <- lapply(mexicali$station_id, function(x) {
  sinaica_station_dates(x, "Manual")
  })
names(ll) <- mexicali$station_id
ll
## $`41`
## [1] "2011-06-20" "2019-12-29"
##
## $`39`
## [1] "1997-05-28" "2019-12-29"
##
## $`371`
## [1] "1997-02-03" "2019-12-23"Furthermore, SINAICA only provides manually collected data, whereas the Mexicali air quality website provides hourly, automatically collected data. It appears that this newer information source has not yet been integrated into SINAICA.
Errors in validation
Data reported to SINAICA should be checked for extreme values and errors, though this is frequently unfeasible. When querying data from the SINAICA website, it automatically removes values above the following thresholds:
- O3: 0.2 ppm
- PM10: 600 µg/m³
- PM2.5: 175 µg/m³
- NO2: 0.21 ppm
- SO2: 0.2 ppm
- CO: 15 ppm
However, in cities like Mexico City and Guadalajara, O3
levels have occasionally exceeded 0.2 ppm. The functions in this package
include a remove_extremes option to mimic this behavior,
but it is disabled by default.
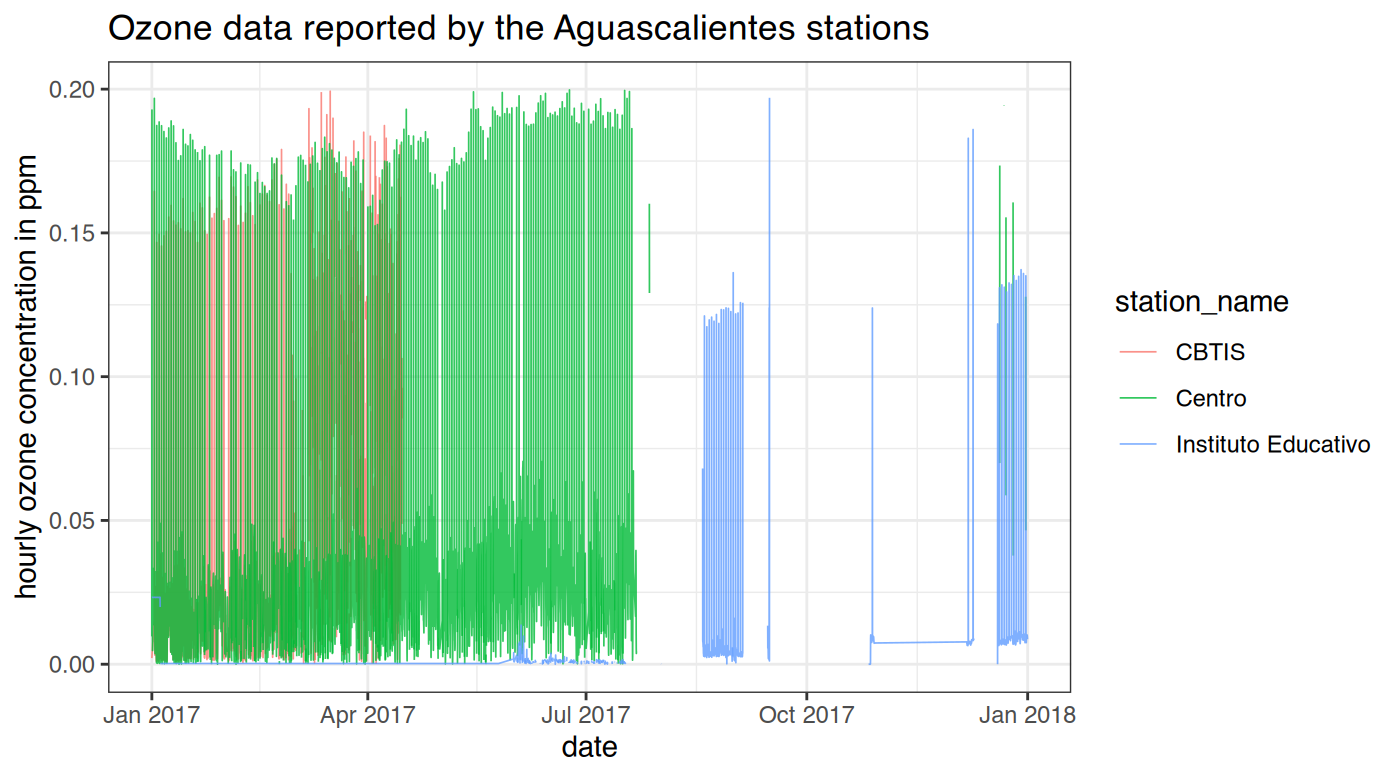
The CBTIS station in Aguascalientes reported highly erroneous ozone
data in 2017, even with remove_extremes = TRUE, as shown in
the chart below. A value exceeding 0.155 ppm would trigger a phase I
contingency in Mexico City. Given that ozone production relies on
chemical reactions between nitrogen oxides and volatile organic
compounds in sunlight, such high levels are extremely improbable at
night or in the early morning.
## Download data for all Aguascalientes stations for a single month
get_month <- function(start_date, end_date, net){
  bind_rows(
    lapply(stations_sinaica$station_id[stations_sinaica$network_name %in% net],
           sinaica_station_data, "O3", start_date, end_date, "Crude",
           remove_extremes = TRUE)
  )
}
## Download data for 2017, by month
df <- bind_rows(
  mapply(get_month,
         seq(as.Date("2017-01-01"), as.Date("2017-12-01"), by = "month"),
         seq(as.Date("2017-02-01"), as.Date("2018-01-01"), by = "month") - 1,
         "Aguascalientes", SIMPLIFY = FALSE)
  )

df$datetime <-  with_tz(as.POSIXct(paste0(df$date, " ", df$hour, ":00"),
                                  tz = "Etc/GMT+6"),
                       tz = "America/Mexico_City")
ggplot(df, aes(datetime, value, group = station_name, color = station_name)) +
  geom_line(alpha = .8, size = .3) +
  ggtitle("Ozone data reported by the Aguascalientes stations") +
  xlab("date") +
  ylab("hourly ozone concentration in ppm") +
  theme_bw()